SPECIFIC DNA LABELLING
In oncology, the detection of
the pathological cell is the most developed application. This
detection is essentially based on the measurement of abnormal
DNA content in the nucleus of the tumor cell. Many studies now
use DNA measurement in cytometry: in plants, animals,
parasitology...
Specific
DNA Labeling
There are many DNA dyes available
for FCM studies.
Hoechst is a benzimidazole derivative that emits blue fluorescence
when excited in the UV. It has a high affinity for DNA and binds
preferentially to A-T bases, but it is not an intercalator. DAPI
has the same characteristics as Hoechst and can be interchanged
with it.
Mithramycin, chromomycin are antibiotics excitable at 445nm and
emit at 575 nm (orange). They bind to G-C regions by
non-intercalating mechanisms.
Propidium iodide and ethidium bromide are the most commonly used
dyes. These two dyes are intercalators of both DNA and RNA double
strands. Both are excitable in the blue and emit in the red (615
nm).
There are many other molecules allowing to mark DNA with very
different spectral characteristics allowing to use many different
excitation sources like Sytox (blue, green, orange, red), Vybrant
DyeCycle (purple, green, red)...
Some of them do not cross the membrane barrier like PI, DAPI and
Sytox. This property can be exploited to differentiate living cells
from dead cells since the latter have lost their membrane inequity.
Living cells do not take up the dye while dead cells become
fluorescent. It is also possible to permeabilize them so that the
dye can access the DNA.
Other dyes, such as Vybrant, can diffuse through the cell membrane
to label the DNA, allowing us to obtain information on the DNA
content of living cells.
Stichiometry of labeling
It is important that the
fluorescence emitted by the probe is proportional to its binding
to the DNA. Otherwise it is not possible to measure an accurate
DNA content.
Intercalators, although their binding is related to the
accessibility of the DNA, are more used to measure DNA content
because the content of A-T and G-C does not affect their binding.
Elimination
of doublets
The reliability of the results
relies on the possibility of not taking into account the
cellular aggregates. Indeed, how to distinguish an aggregate of
2 or more cells since the quantity of DNA measured will be the
multiple of the quantity of a single cell.
The method used is based on the possibility of analyzing the
profile of the signal collected, its area, its height or its
time of flight (TOF, width depending on the machine) (Figure
1).
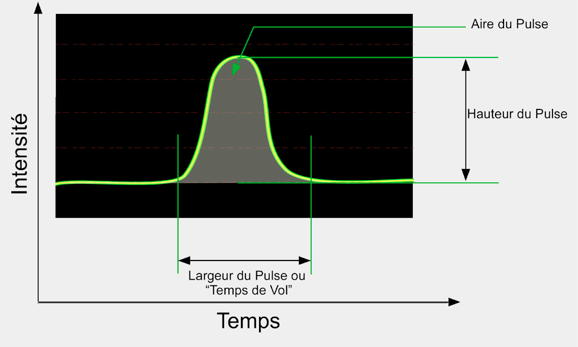 Figure
1 : Signal profile
Figure
1 : Signal profile
Using combinations of these parameters, it is possible to
distinguish doublets from singlets (
Figure 2). This
methodology is also used for cell sorting to avoid contamination
of the sorting by unwanted cells. Indeed, during the sorting, the
cytometer sees the aggregate as a single cell, if this aggregate
is composed of a negative cell and a positive cell, it will be
seen as a positive cell. If this aggregate is sorted as such,
there will be a negative cell sorted at the same time as the
positive cell, resulting in a decrease in the purity of the sorted
cells.
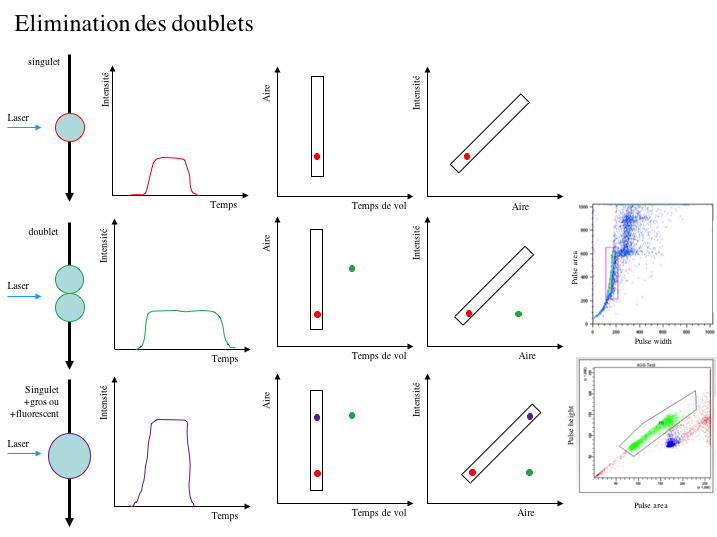 Figure
2 : Principle of doublet elimination
Figure
2 : Principle of doublet elimination
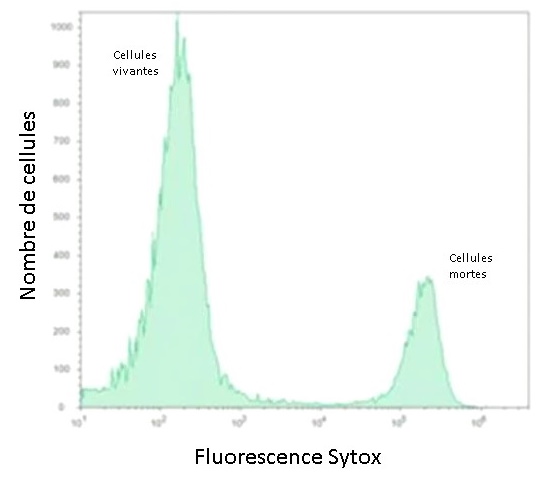
Cell viability
The use of DNA markers that do not cross the membrane barrier
makes it very easy to determine the percentage of living/dead
cells. Dead cells with altered membranes that allow the dye to
pass become fluorescent (Figure 3).
Figure 3 : Dead cells
labeling by Sytox
When labeling complex populations,
this type of labeling is important because dead cells very often
show non-specific labels that can distort the results. In the case
of cell sorting, it avoids sorting dead cells if the sorted
population is to be put back into culture.
Evaluation
of DNA quantity
By permeabilizing the cells, DNA
labelling will allow to quantify the quantity present in the cell.
Be careful however, double stranded RNA can also be marked by the
intercalants and will be added to the measurement of the DNA, to
avoid this it will be necessary to use a marking buffer degrading
this RNA (RNase). It is also necessary that the accessibility of
the DNA to the dye is optimized. There are many DNA marking
protocols depending on the cell type, it is advisable to test
one's own cells with several protocols so that the measurement is
optimized.
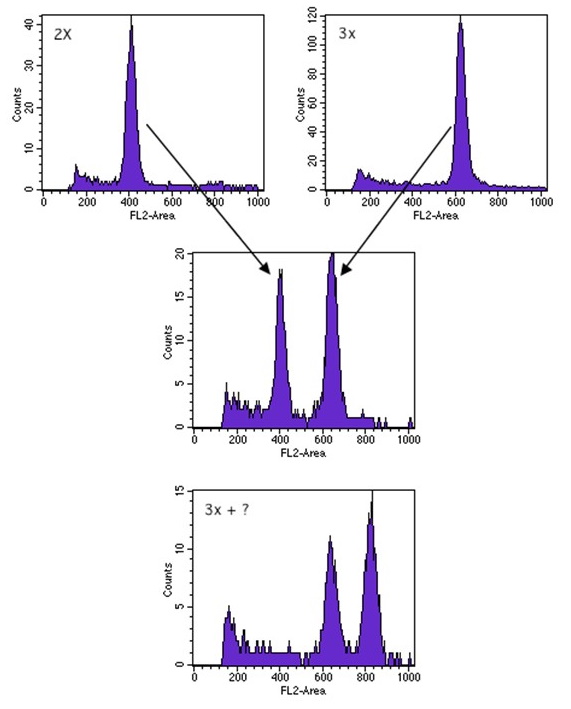
This application is used in many
fields such as agricultural research where it has been found, for
example, that the amount of DNA in certain plants varies according
to altitude or geographical location (the higher the altitude, the
more DNA, gradient of DNA quantity between coffee trees in West
Africa and East Africa) (Figure 4), and in fish farming, where it
was observed that triploid males had better growth rates than
their diploid counterparts, hence the search for rearing
conditions to obtain a majority of triploid males (temperature, pH
of the environment). ..
Figure 4 :Measurement of the
amount of DNA in coffee plants. Top, 2X and 3X control plane.
Middle 2X and 3X mixture. Bottom 3X control mixture and
unknown sample measured at 4X.
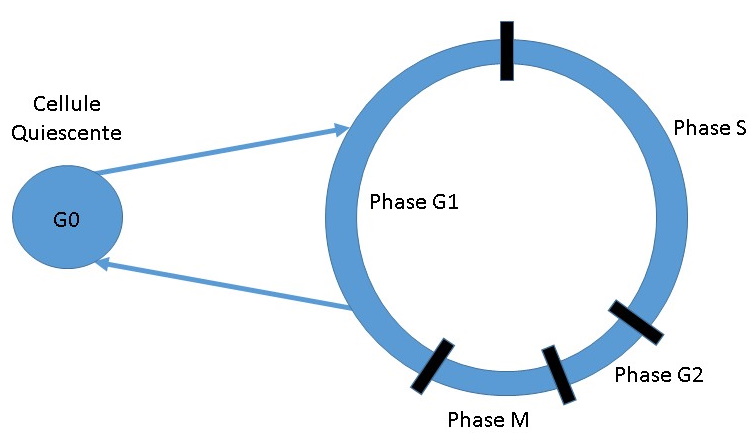
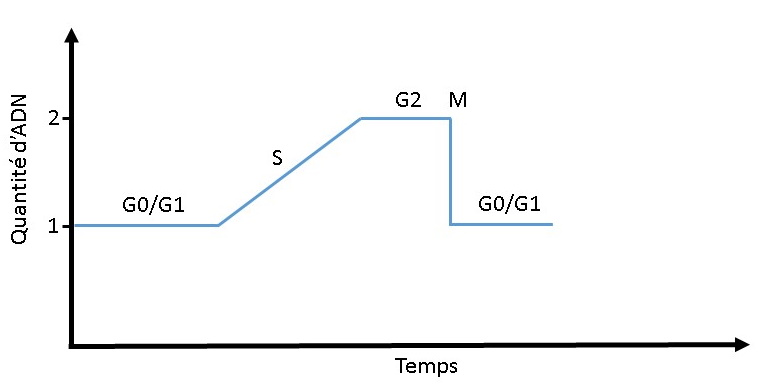
Cell cycle
"The cell cycle represents the
entire period of division, that is, all the biochemical and
morphological events that are responsible for cell proliferation".
Measurement of the cell cycle by conventional FCM methods divides
the cycle into three phases: G0/G1, cell activation phase, S, DNA
synthesis phase, G2/M mitosis phase (Figure 5 and 6). The
distinction between G0 (quiescent phase) and G1 (preparation phase
for DNA synthesis) as well as G2 (preparation for mitosis) and M
(mitosis) is impossible with a method using an intercalant as
propidium iodide.
Figure 5 : The different
phases of cell cycle
Figure 6 : DNA quantity
evolution during cell cycle
FCM offers a fast and easy to implement
methodology for cell cycle analysis. It allows to follow the
distribution of cells in the different phases of the cycle
according to various stimuli or to the addition of certain drugs.
It also allows to see the presence of cells with abnormal DNA
content...
Most of the applications concerning the cell cycle use only one
parameter, the DNA content (Figure 7). Mathematical
programs calculate the different phases of the cycle. The main
applications concern pharmacology: study of the effect of drugs on
the cell cycle, cancerology: to determine the proliferation of a
tumor and to see its DNA content compared to normal cells.
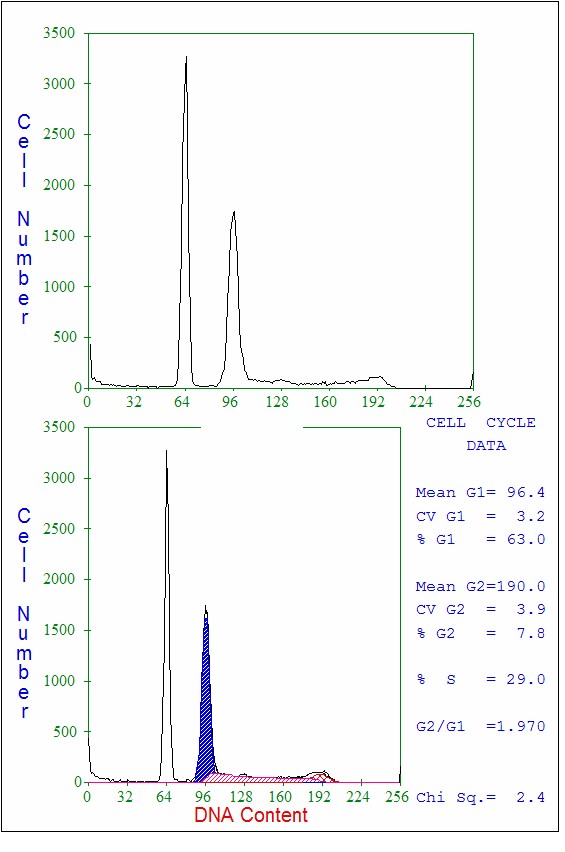 Figure
7 : Cell cycle analysis of a tumor cell line.
Figure
7 : Cell cycle analysis of a tumor cell line.
There are other methods of cell
cycle assessment that can calculate more cell cycle parameters.
These methods use classical DNA labelling with an intercalant but
add the incorporation of thymidine analogues. The BrdU technique
requires the cells to be cultured with this analog (Figure 8)
which is incorporated during the DNA synthesis phase. It will then
have to be revealed by means of a specific antibody capable of
penetrating the nucleus to bind to BrdU. This method required the
denaturation of the DNA with hydrochloric acid which denatured the
proteins and prevented the coupling of the cycle label with a
membrane marker. There is now a milder variant allowing to study
in addition the markers by immunofluorescence (Carayon et al.). By
adjusting the incubation times with the thymidine analogue,
information on the kinetics of the cell cycle can be calculated.
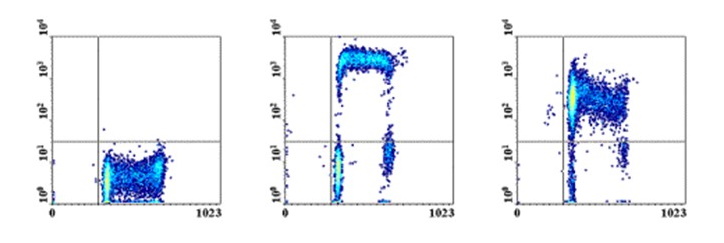
Figure 8 : Cell cycle labeling
with BrdU. In X, propidium iodide labeling, in Y BrdU
labeling. On the left, single IP labeling, in the middle,
double labeling on standard cells, on the right, double
labeling on S-phase blocked cells
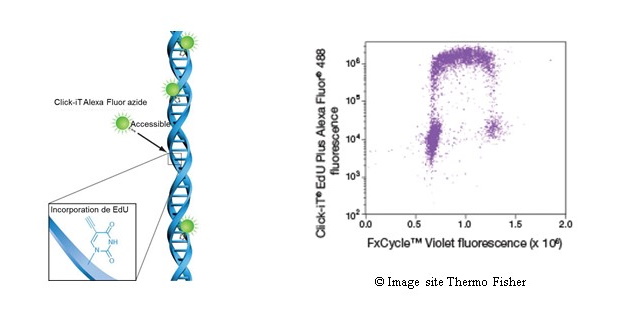
New methods that do not require
DNA denaturation have appeared on the market, such as the ClickIt
method from ThermoFischer, which uses a modified thymidine
analogue (modified EDU). The revelation is done without
denaturation because the revelation molecule is small enough to
bind to the modified EDU after fixation and permeabilization by a
detergent (Figure 9).
Figure 9: Cell cycle
labeling by the ClickIt technique. On the left the
principle, on the right double ClickIt labeling (in Y) with
FxCycle DNA label (in X).