
OTHER APPLICATIONS
Reporter genes.
According to the Wikipedia definition: 'A reporter gene is a gene whose product (protein) has a characteristic that allows it to be observed in the laboratory (fluorescence, detectable enzymatic activity). Reporter genes are used to visualize or measure the expression of a gene of interest. For this purpose, the reporter gene can be fused to the gene under study, or put under the control of the promoter of the latter'.
In cytometry, reporter genes are widely used for the selection of modified populations when using cell sorters. The advantage of this methodology is that it is not necessary to use an antibiotic selection. There are many different reporter genes with different spectral characteristics as shown in Figure 1 (Tounsia Aït Slimane, CHU St Antoine). It is also possible to use several reporter genes in the same experiment.

Figure 2 : Comparison of a line before and after integration of a fluorescent reporter gene (GFP).
Protein quantification
Flow cytometry is a method that provides relative information about the size, morphology and intensity of a label. However, it is possible to determine with more precision the amount of proteins present on the surface of a cell or circulating by calibrating the apparatus.
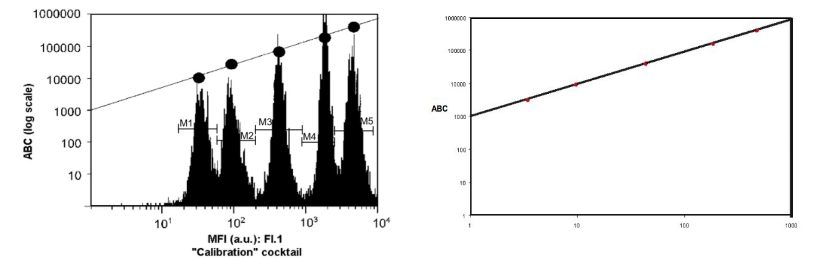
For the quantification of membrane antigens, there is for example a kit of beads allowing to define a standard curve necessary for the calculation of the number of antigens present by cell (QUIFIKIT marketed by Agilent). The principle consists in using beads with a known quantity of antigens which will be used to determine the standard curve. The kit integrates, in addition to a tube with 2 types of beads (negative and high density of antibodies), five populations of beads with increasing and known densities of mouse antibodies. The presence of these antibodies will be revealed by the use of goat F(ab')2 fragments recognizing the mouse antibody present on their surface. This antibody will be used under saturating conditions to reveal the antibodies present on the beads but also the mouse antibodies used to reveal the presence of antigens on the surface of the cells tested (Figure 3). It will then be sufficient to plot the average fluorescence intensity of the studied population to determine the antigen density of the measured antigen.
As with the QUIFIKIT, by creating a standard curve, one will be able to determine with precision the concentration of the protein studied. By using beads that fluoresce according to the type of protein to be detected and by adjusting the fluorescence intensity of these beads, Becton Dickinson is able to provide kits (CBA, ©, Becton Dickinson) capable of analyzing up to 30 different proteins in the same sample at concentrations as low as 0.274 pg/liter. An example of a CBA assay is shown in Figure 5. The advantage of this type of assay is that it requires only 25 to 50 microliters of sample to analyze.
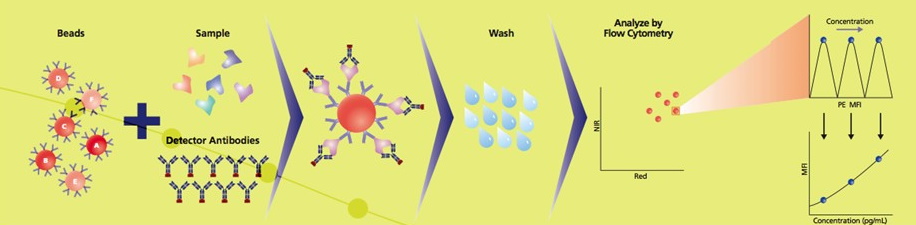
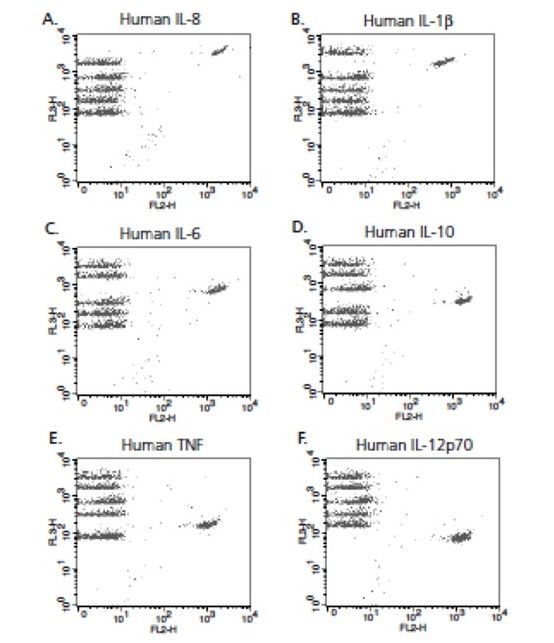
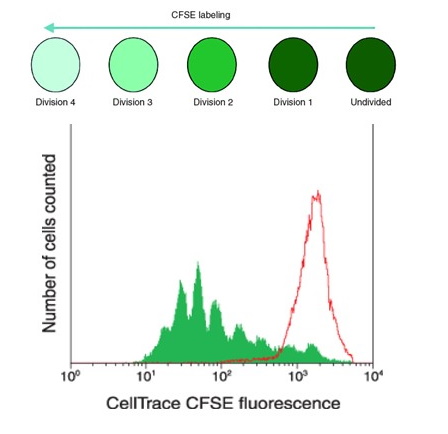
Figure 6 : Principle of cell proliferation measurement (red time=0, green curve after several divisions)
Stem cell analysis
Stem cells are undifferentiated cells capable of generating specialized cells of all types by cell differentiation. They raise great hopes in biotherapies and are the subject of much research.
LThe first method to visualize/separate these cells by flow cytometry was based on a specific characteristic of these cells which were able to expel a dye (Hoechst 33342) from their cytoplasm towards the outside of the cell. This dye, which diffuses through the cell membrane and marks the DNA being expelled from the stem cells, showed less marking visualized by cytometry (Figure 7). By extension, these stem cell populations were called Side Population. The externalization of the dye is an active phenomenon that can be inactivated with a drug, Verapamil. The addition of Verapamil inhibits the process, so the SP cell population disappears when analyzed with Hoechst 33342. The problem with this technique was that it required the use of powerful UV lasers and was therefore not widely used.
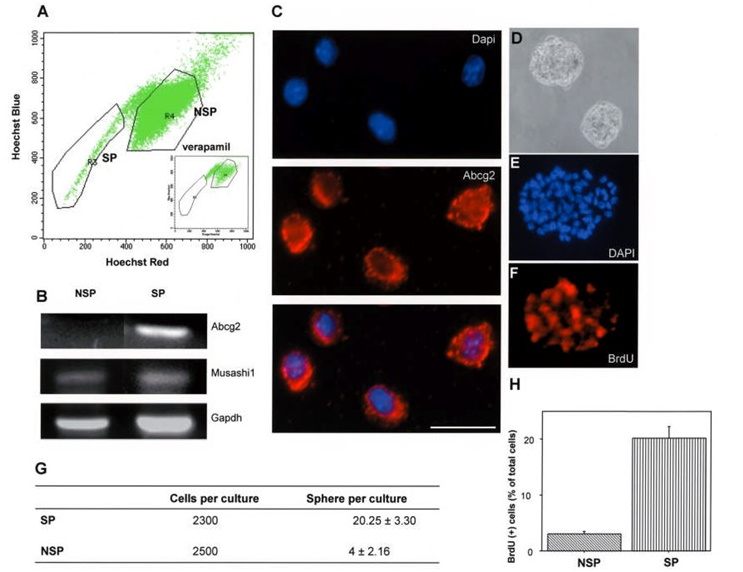
Figure 7 : Stem cell analysis (Side Population: SP) by Hoechst 33342 exclusion
Another method is to use ALDH (aldehyde dehydrogenase) activity to isolate these stem cells. About 30 years ago, a team discovered that progenitor cells had ALDH activity. The development of a specific fluorescent substrate made it much easier to study these cells. It consists of a hydrophobic and non-toxic molecule that diffuses freely into the cells. Once in the cell, it is metabolized in ALDH cells and becomes trapped. It accumulates when the active transport systems are neutralized (mainly by a 4 degree hold). The measured fluorescence is therefore proportional to the ALDH activity. The negative control is obtained by the use of DEAB which inhibits ALDH activity (Figure 8).
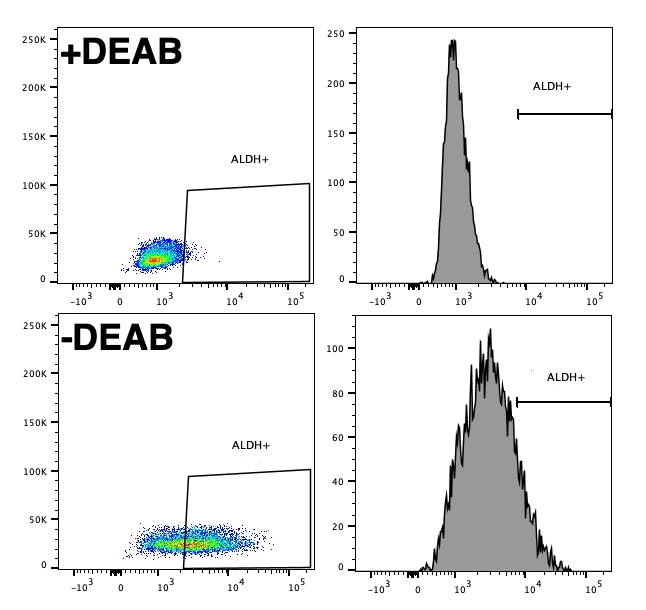
Figure 8 : Labeling of ALDH activity on a cell line with the Aldefluor © kit