TECHNICAL PRINCIPLES OF FCM
The principles of cytometry are summarized in Figure 1.
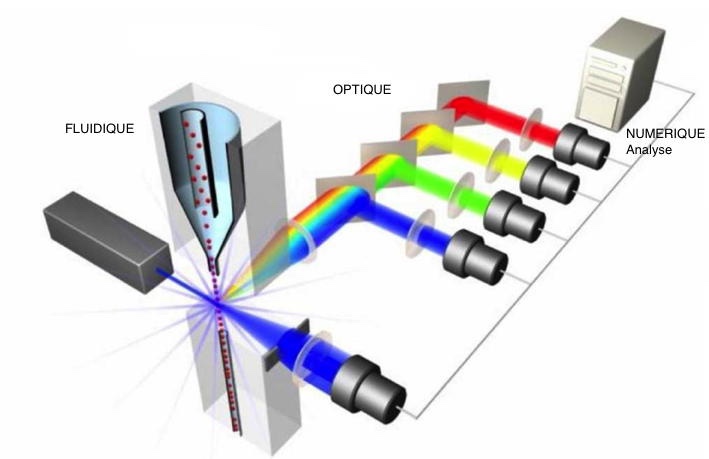
Figure 1 : Simplified principle of a flow cytometer
To operate a flow cytometer requires a combination of:
Fluidic: To introduce and focus the cells.
Optics: A source of excitation and signal recovery,
Electronics: To convert the optical signals into proportional
electronic signals and digitize them for analysis with a computer.
CELL SAPLES
The cells must be suspended in
order to be analyzed. The analysis of blood does not pose any
problem as the cells are already in suspension. On the other hand,
the cellular tissues must be dissociated and the aggregates
eliminated in order to be analyzed.
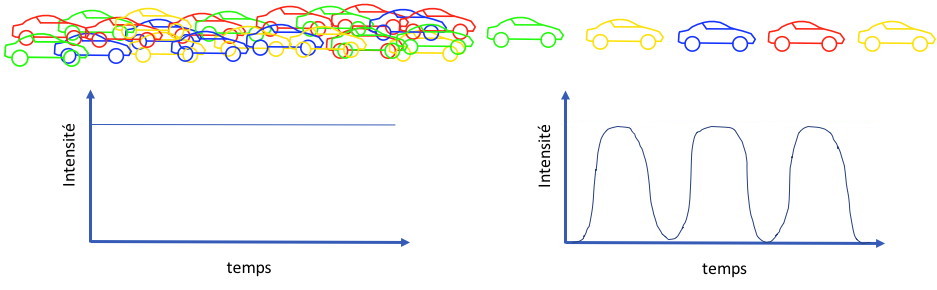
HYDRODYNAMIC FOCUSING
Imagine having to count vehicles
of different colors on a highway with many lanes (
Figure 2).
If the traffic is heavy and all the lanes are in use, it will be
impossible to perform this task. To do this, you need to channel
the vehicles into one lane and, in this way, you will be able to
make an accurate analysis of the number of vehicles of each color.
Figure 2 : Counting
principle of a cytometer
In a flow cytometer the same procedure is used. The cells are
brought to the center of the measuring nozzle and aligned one
behind the other (by means of the hydrodynamic sample centering
system) to be excited one by one with the light beam. The sheath
liquid undergoes a progressive acceleration which causes the
sample liquid to stretch and thus aligns the cells in the center
of the jet (
Figure 3).
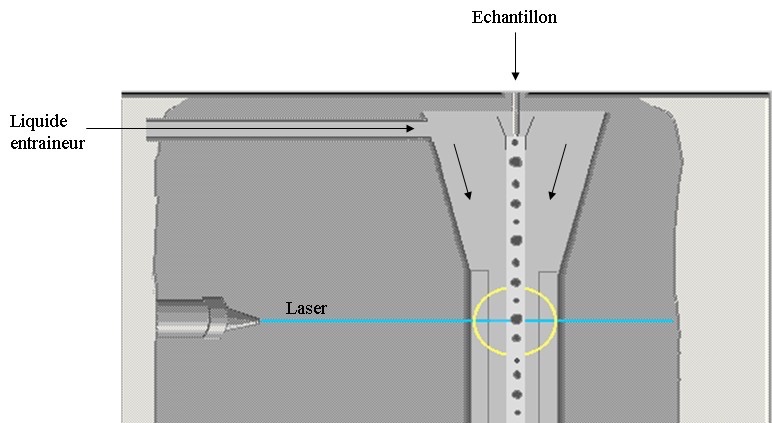 Figure
3 : Hydrodynamic Focusing
Figure
3 : Hydrodynamic Focusing
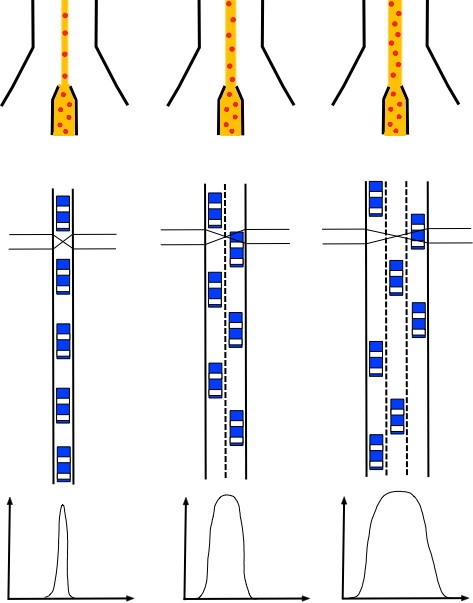
When the starting sample is low in concentration, the user of a
cytometer tends to increase the pressure on the sample in order to
decrease the acquisition time. Unfortunately, this has the effect
of decreasing the precision of the sample centering and leads to a
scattering of the measurements since the cells will not
necessarily pass through the focusing zone of the light source (
Figure
4). This is easily visualized by passing calibration beads
at different pressures, their peak widens as the pressure
increases (increase in the coefficient of variation). This effect
is particularly detrimental to cell cycle measurements where the
sharpness of the peaks is a guarantee of the quality of the
measurement. It is therefore preferable to increase the
concentration of the sample rather than to increase the pressure
on it. Of course, one must also take into account the information
processing limits of the device. Similarly, by increasing the
speed too much, we can find ourselves in a situation where several
particles pass in front of the light source at the same time,
compromising the reliability of the measurements.
Figure 4 : Effect of the pressure
increase on the sample on the signal measurement
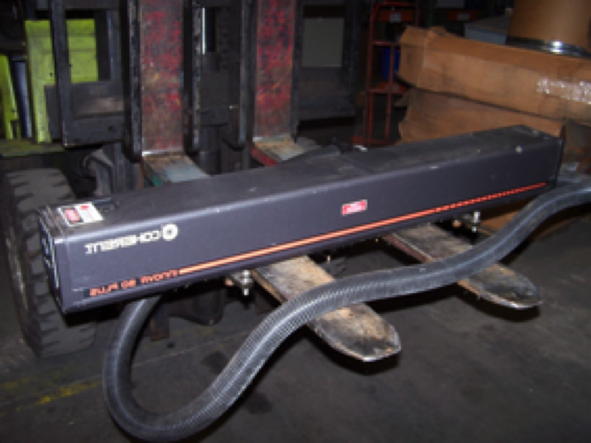
OPTICAL CIRCUITS
The light excitation source must
allow an illumination of the dyes at a wavelength close to their
absorption maximum. It must be powerful, stable and requires a
good focusing.
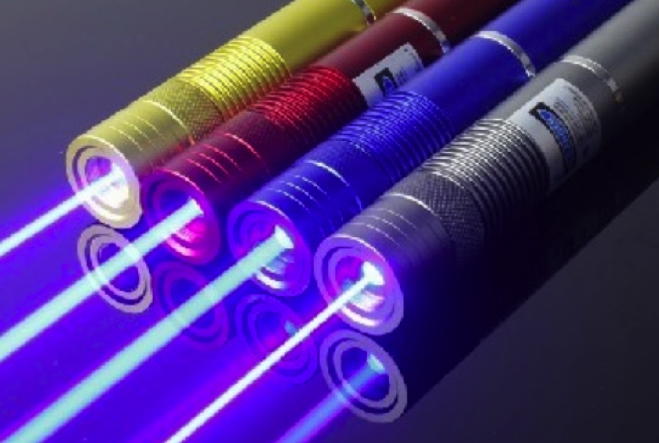
Two types of sources are currently used:
-Lasers (the most frequently used) which have a large number of
advantages: power, stability, beam sharpness. Lasers have
discontinuous emission spectra (Figure 5).
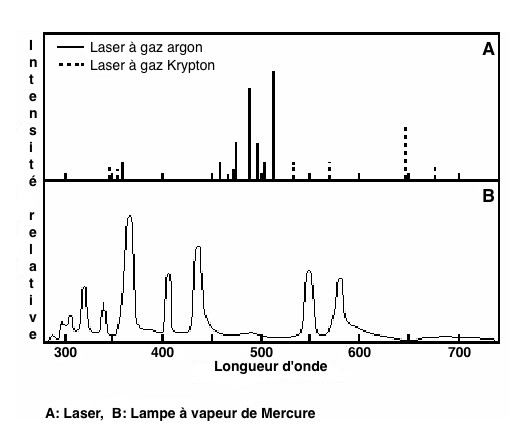
Figure 5 : main light sources used in flow cytometry
Argon ion lasers are now replaced by laser diodes requiring less
installation constraints
The presence of several lasers of different types allows to multiply
the number of fluorochromes with different spectral characteristics.
Mercury vapor or xenon lamps were also used. The focus is less than
in the case of the laser, but the spectrum is wide enough and their
cost is limited.
When there are several lasers in a cytometer, they can be arranged
in 2 ways. Either they are all focused at the same place, they are
then said to be collinear, or they are spatially shifted (the cell
passes successively in front of each laser), they are then said to
be staggered.
The interest of staggered lasers is that it allows, for
fluorochromes with different excitation wavelengths but with
equivalent emission wavelengths to be measured independently which
is not possible with collinear lasers (
Figure 6). Colinear
lasers therefore lead to greater constraints in the choice of
fluorochromes.
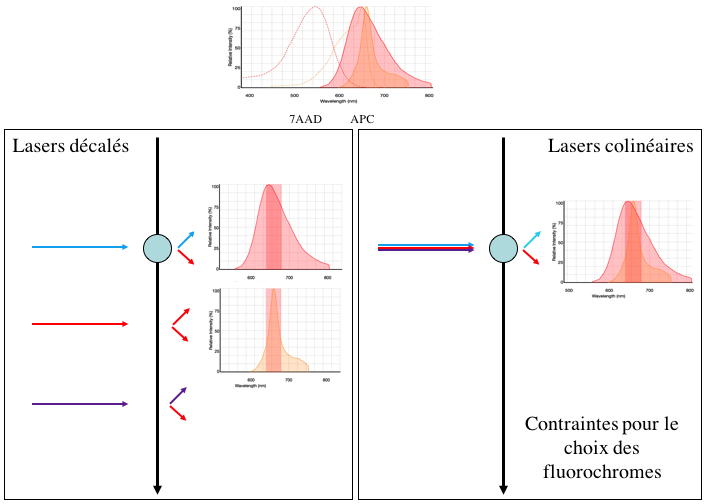 Figure
6 :Laser configuration, staggered and collinear, example of
7AAD and APC
Figure
6 :Laser configuration, staggered and collinear, example of
7AAD and APC
COLLECTION OF EMITTED LIGHT
The different optical signals
emitted by the cell must be focused, separated, and then routed to
detection systems, photomultipliers or photodiodes. They are
selected by different optical circuits, composed of alternating
mirrors and filters.
A mirror is a reflecting surface. Depending on the treatment of
its surface, we can obtain three types of mirrors: high-pass,
low-pass and bandpass (Figure 7, 8). Moreover, the reflected
wavelengths also vary with the angle formed by the incident ray
and the surface of the filter.
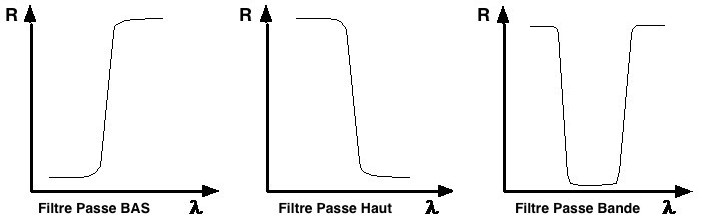
Figure 7 : Different types of filters used by cytometry (R:
Réflection, : wavelength)
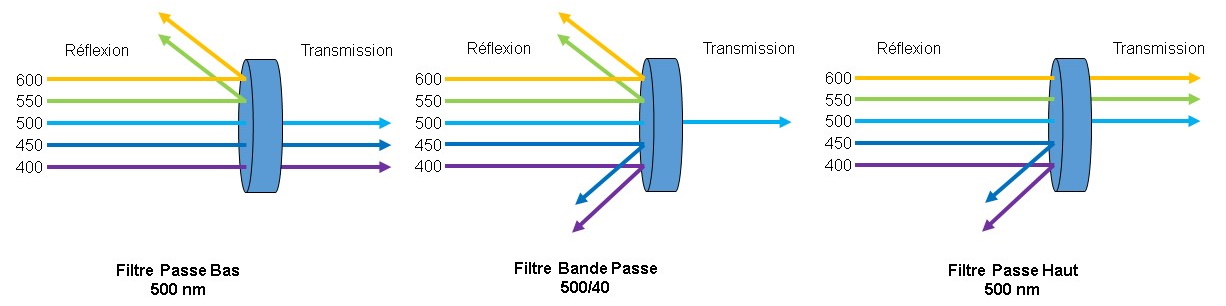 Figure
8 : Different types of filters used by cytometry
Figure
8 : Different types of filters used by cytometry
If the non-reflected wavelengths are transmitted, we obtain dichroic
mirrors.
For filters, we find in transmission the same curves as for mirrors,
but the non-transmitted wavelengths are not reflected. They are
either absorbed or destroyed.
After passing through this succession of mirrors and filters, the
light is collected and transformed into an electrical signal
directly proportional to the light received by a photomultiplier or
a photodiode (Figure 9).
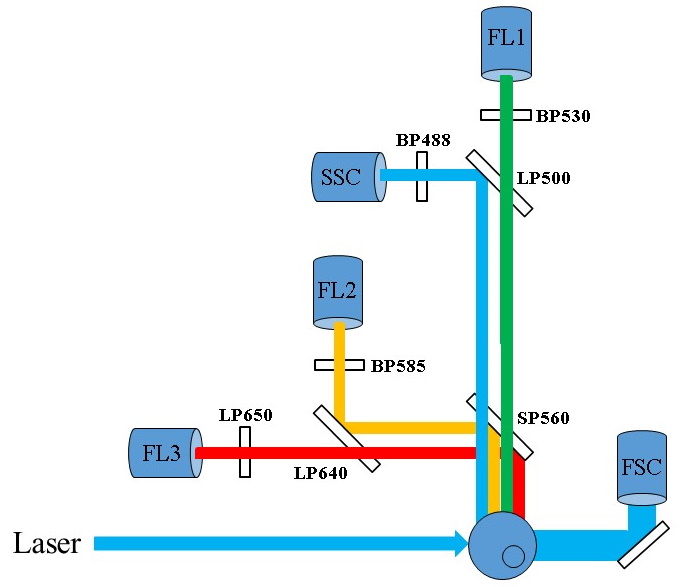
 Figure
9 : Example of an optical path in a flow cytometer (©Becton
Dickinson)
Figure
9 : Example of an optical path in a flow cytometer (©Becton
Dickinson)
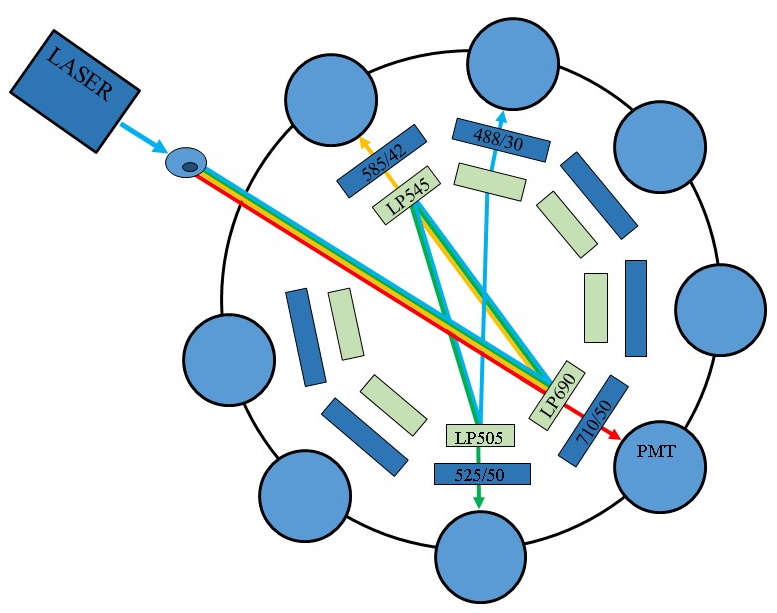
Figure 10 : Example
of an optical path in a spectral flow cytometer
(©Cytek)
SIGNALS COLLECTED
The optical signals collected have an intensity correlated with
cellular properties (Table 1).
| PARAMETER |
INFORMATION |
USE |
| Light scattering at small angles |
Proportional to cell diameter |
Morphological identification of cells |
| Right angle light scattering |
Proportional to cell content |
Morphological identification of cells |
| Fluorescences |
Proportional
to the labeling intensity |
Cell markers,
DNA, RNA, cell functions... |
Table 1: Meaning of the main
signals obtained in flow cytometry.
Scattered light
The scattered light provides
information about the morphology and structure of the cell:
If light scattering is measured in the axis of the incident beam,
the signal intensity can be correlated with cell size and
viability.
At an angle of 90°, the measurement corresponds to the
intracellular structure of the cell (cytoplasm refringence,
morphology, nucleo-cytoplasmic ratio).
The simultaneous use of these two parameters makes it possible to
distinguish, in peripheral blood for example, platelets,
lymphocytes, monocytes and polynuclears (Figure 11).
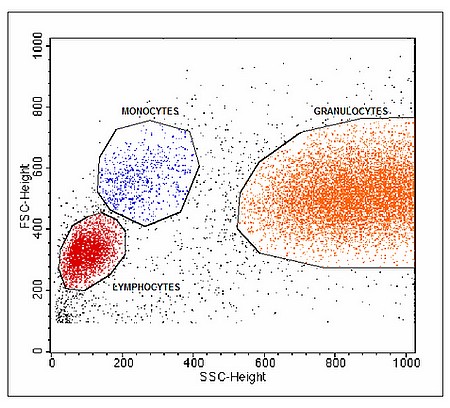
Figure 11 :Use of double light scattering to distinguish the
various blood subpopulations (FSC: small angle scattering, SSC:
wide angle scattering).
Thershold
The choice of the threshold allows
to eliminate from the analysis the particles of values lower than
the threshold chosen on the selected parameter. For example, a
threshold on the size will eliminate the smallest particles and
thus avoid polluting the acquisition file with them. This can be
used, for example, to eliminate platelets or red blood cells from
an acquisition on lymphocytes. Be careful not to choose a
threshold that is too high, otherwise you risk not seeing certain
cell populations of intermediate size or even non-fluorescent if
you choose to set a threshold on a fluorescence. The threshold on
a fluorescence is useful to analyze a cell cycle since it allows
to avoid measuring non fluorescent cells or small DNA fragments.

Emitted fluorescence
This fluorescence can be
spontaneous, but most often, it is brought to the cell by a
fluorochrome. The fluorochrome absorbs the energy of the LASER and
re-emits the absorbed energy by vibration and heat dissipation,
emitting photons of a higher wavelength.
A fluorochrome is characterized by its absorption and emission
light spectrum. The re-emitted light is always of a higher
wavelength than the absorbed wavelength.
The characteristics of some fluorochromes used in CMF are
summarized in Table 2 :
FLUOROCHROME
|
USE
|
Excitation
Max*
|
Emission
Max@
|
Hoechst 33342
|
ADN
(A-T)
|
365
|
402
|
DAPI
|
ADN
(A-T)
|
357
|
451
|
Chromomycine A3
|
ADN
(G-C)
|
450
|
470
|
Iodure de Propidium
|
ADN
|
536
|
620
|
Acridine Orange
|
ARN/ADN
|
492
|
527
db/630 sbrin
|
Alexa 488
|
Protein
labeling
|
498
|
520
|
FITC
|
Protein
labeling |
490
|
543
|
PE
|
Protein
labeling |
490/565
|
578
|
PerCP
|
Protein
labeling |
488
|
675
|
APC
|
Protein
labeling |
642
|
660
|
PE-Cy5.5
|
Protein
labeling |
490/565 |
693
|
PE-Cy7
|
Protein
labeling |
490/565 |
778
|
Brilliant Violet 510
|
Protein
labeling |
405
|
510
|
| Brilliant Violet 650 |
Protein
labeling |
405
|
650
|
| GFP |
Gene
Reporter |
488 |
510 |
| mCherry |
Gene
Reporter |
585
|
610
|
dTomato
|
Gene
Reporter |
554
|
580 |
Rhodamine 123
|
mitochondrial
potential
|
505
|
534
|
BCECF-AM
|
pH
|
440
|
530
|
SNARF-1
|
pH/traceur
|
488
|
580/630
|
CFSE
|
cell
tracker
|
498
|
518
|
Cascade blue
|
cell
tracker
|
399
|
423
|
Fura Red
|
Ca2+
|
450-500
|
660
|
Indo1-AM
|
Ca2+ |
331
|
405/480
|
Fluo-3
|
Ca2+ |
506
|
526
|
Table
2 : Characteristics of some fluorochromes used in cytometry. (*:
excitation wavelenght, @: emission wavelenght).
There are
- Fluorochromes with a specific affinity for a cellular component:
for example for the measurement of DNA, RNA, proteins, pH, calcium
contained in the cell.
- Fluorochromes coupled to a specific ligand. This specificity can
be achieved by coupling the fluorochrome to an antibody or a
ligand specific to a cell component.
Be careful because the fluorochromes do not all have the same
fluorescence yield and therefore will not have the same detection
capabilities. To demonstrate this, it is 'sufficient' to couple
the same antibody with different fluorochromes and to compare the
intensity of the labelings on the same cells (
Figure 12).
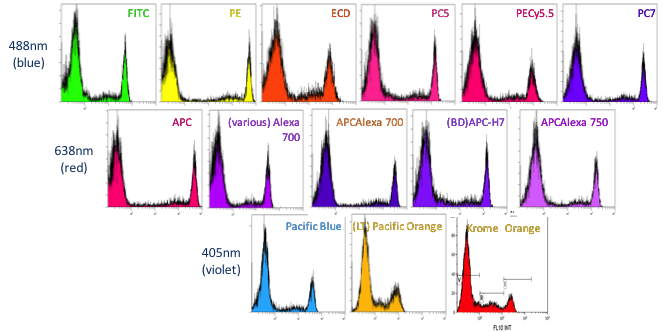
Figure 12 : Study of the sensitivity of fluorochromes by
labelling with a CD8 antibody (©Beckman
Coulter : O Jaen) SIGNAL CONVERSION
The optical signals are converted
into electrical signals by the photomultipliers. These electrical
signals have a value usually between 0 and 10 volts (analog
signal). The computer can only process these data if they are in
binary form (digital signal). The role of the analog-to-digital
converter is to convert, as its name indicates, an analog signal
(continuous value) into a digital signal (discontinuous value)
that can be processed by the computer. That is to say, to
transform a value between 0 and 10 volts into a binary value
between 0 and 1023 for a 10-bit converter (210) (Figure
13).The new machines now convert signals on several million
channels.
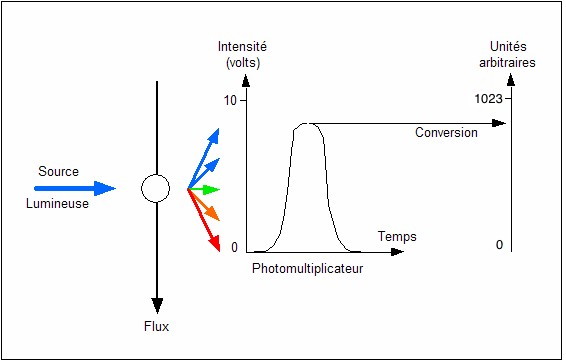
Figure 13: Working principle of a converter
PRESENTATION OF RESULTS
The numerical values from the
converters are stored by the computer and presented on the
cytometer screens in two forms:
1/monoparametric histograms where the x-axis represents the
intensity of the analyzed signal and the y-axis the number of
cells, the axes can be linear or logarithmic (
Figure 14).
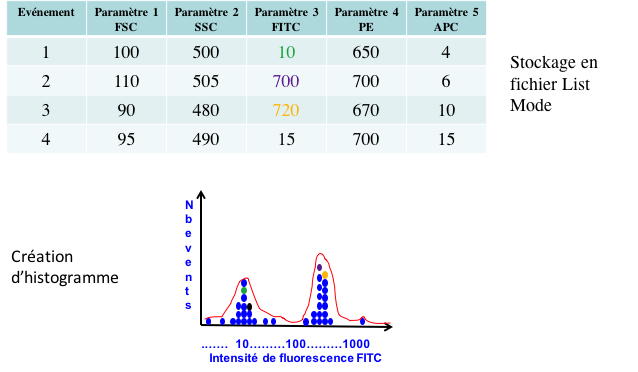
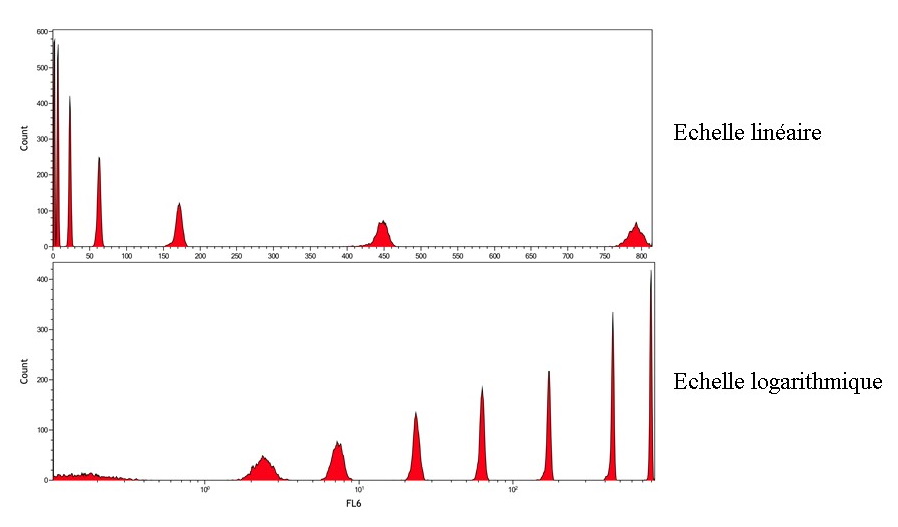
Figure 14 : Obtaining a monoparametric histogram.
2/biparametric histograms or cytograms presenting two signals
simultaneously (
Figure 15).
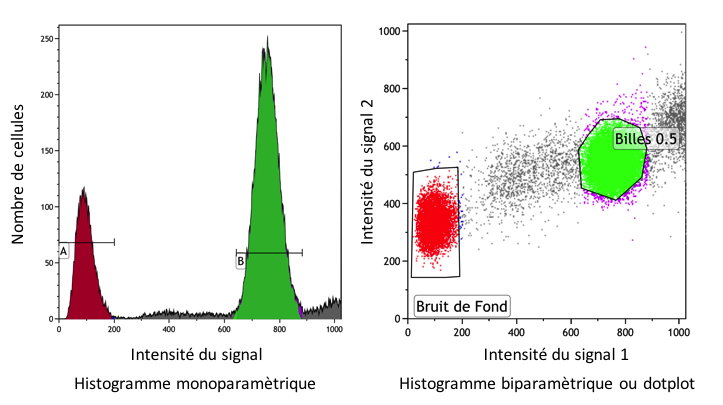
Figure 14 : Presentation of flow cytometry results.