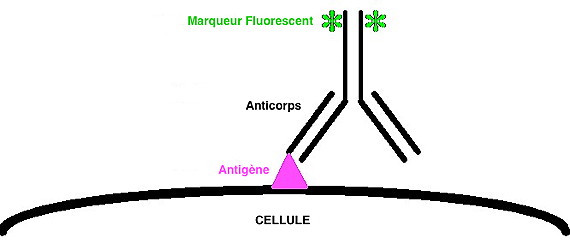
IMMUNOFLUORESCENCE CHARACTERIZATION OF CELL SUBPOPULATIONS
Hematology was one of the first
medical disciplines to benefit from the clinical applications of
CMF. Some of these applications are now regularly used for the
diagnosis or therapeutic follow-up of various diseases. These
applications concern the functional study of healthy cells as well
as the demonstration of the pathological character of the analyzed
cells.
The combination of
immunofluorescence and flow cytometry (FCM) has become an
essential element in the study of biological systems, especially
in the discrimination between cells of a heterogeneous population.
Indeed, the use of monoclonal antibodies (mAbs), directed against
specific components, allows to distinguish lymphocyte
subpopulations. In recent years, the identification and
characterization of lymphocyte surface antigens (Ag) has
progressed very rapidly. However, there is no single mAb that can
recognize a particular cell with certain functions. This
limitation has led users of the immunofluorescence technique to
move from single to multiple labeling using combinations of mAbs
revealed by different fluorochromes.
Compared to the initial investigations performed under the
microscope, FCM also provides quantification of the number of
recognized sites at the individual cell level and the possibility
of sorting these cells according to the intensity of their
labeling for further functional studies. Finally, it can be
combined with the analysis of other parameters (cell cycle,
Calcium) and thus inform us on the functional state of the cells.
Principles of
immunofluorescence
Immunofluorescence methods can be divided into two groups:
Direct reactions where the mAb is directly coupled to a fluorochrome
:
Indirect reactions where the mAb is revealed by a second reagent
coupled to the fluorochrome:
Both methods use fluorescent reagents, antibodies coupled to
fluorochromes. An example of fluorochrome emission spectra used in
immunofluorescence is shown in figure 1.
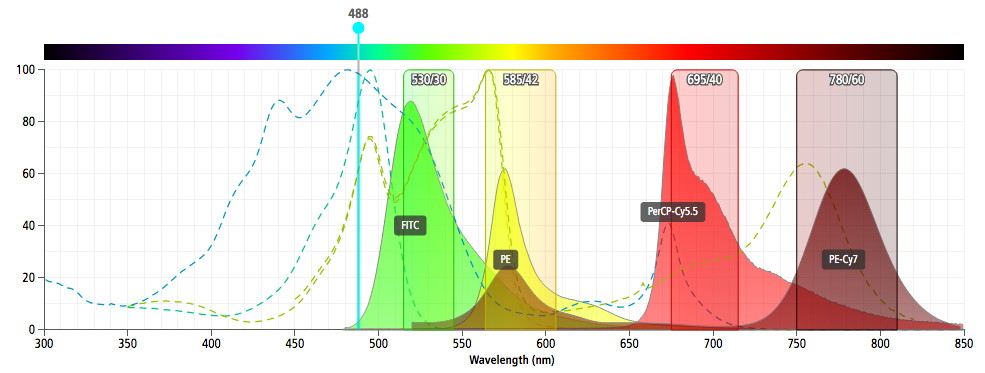 Figure
1 : Emission spectra of 3 fluorochromes used in
immunofluorescence.(© Becton Dickinson, Spectra
Viewer)
For multiple
labeling several fluorochromes are used simultaneously.
In this case, it is necessary that:
-their excitation wavelengths match the light sources of the
cytometer,
-their emission wavelengths are sufficiently distant so that their
signals can be analyzed separately.
-the weakly expressed antigens are revealed by high yield
fluorochromes and the strongly expressed antigens with low yield
fluorochromes.
-in the case of co-expression on a cell, use fluorochromes with
little or no overlapping spectra.
The major obstacle in multiparameter analyses is the significant
overlap in the emission spectra of the fluorochromes used to
reveal the mAbs.
The introduction of multiple lasers in cytometers has made it
possible to overcome such interference by making possible the
excitation of several fluorochromes with distinct excitation and
emission spectra.
To facilitate the choice of fluorochromes, there are many tools
proposed by private companies:
Becton
Dickinson,
Thermo
Fischer,
BioLegend,
Chroma...
Spectral
cytometry, newly arrived on the market, significantly
improves the separation of the various fluorochromes. It also
offers tools to characterize fluorochromes:
Cytek
Before starting any immunolabeling protocol it is important to
verify the quality of the reagents used by testing them on cells
known to present the antigen being analyzed.
The concentration at which the reagent is effective should be
tested by labeling these cells with various concentrations of the
reagent and plotting the labeling intensity as a function of this
concentration (Figure 2):
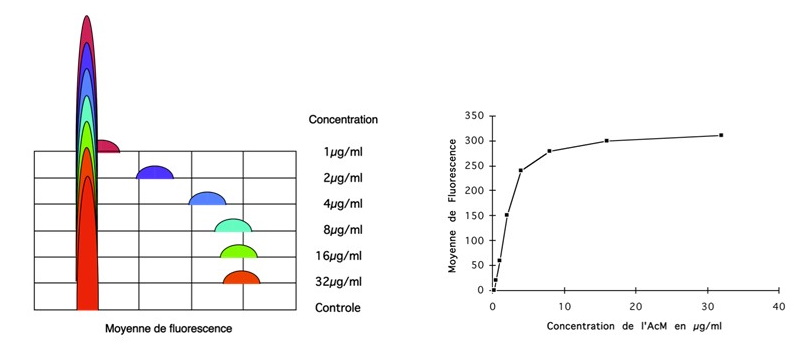
Figure 2 : Effect of the
concentration of an antibody on its labelling capacity.
Principles of fluorescence compensation
Overlapping emission spectra of
the various fluorochromes used in cytometry require the use of
electronic fluorescence compensations to subtract the
superposition of the two fluorescence signals (Figure 3).
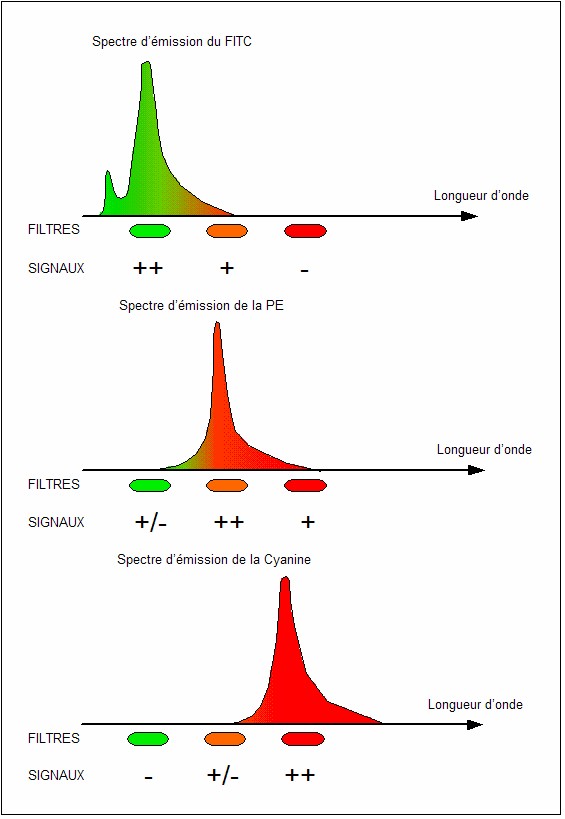 Figure
3 : Fluorescence overlapping.
Thus, without fluorescence
compensation, a cell population labeled in green fluorescence
(FITC) but not labeled in orange fluorescence (PE) is positioned
on the bisector of the biparametric histogram of the two
fluorescences (Figure 4a).
The compensation system artificially subtracts the orange
fluorescence that results from the overlapping of FITC
fluorescence into the PE channel (Figure 4b).
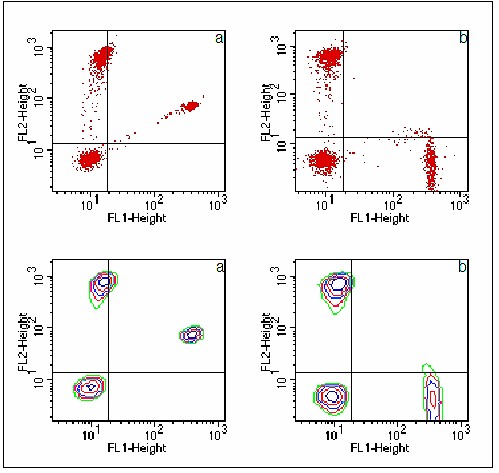
Figure 4 : Effect of fluorescence compensation
Each compensation percentage will thus be determined by analyzing
the cells simply labeled with the various dyes. The negative cells
should be adjusted correctly (A) and then the median over y of the
positive population over x (B) should be adjusted so that it is
equal to the median over y of the negative cells (Figure 5).
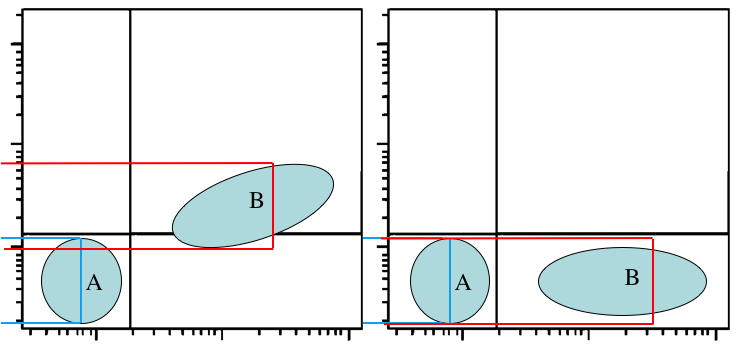 Figure
5 : Fluorescence compensation calculation method:
The median of population B on the Y-axis should be equal to
the median of population A on the same axis.
The common practice for determining a threshold of positivity is
to use isotypic 'tagging' and position a cursor at the foot of the
negative cell peak. This practice is not recommended for multiple
labeling. Indeed, when more than one fluorescence is present and
the compensation is set, the negative value of the labeling may be
greater than in an unlabeled tube. To overcome this problem, the
FMO (fluorescences minus one) method should be used, which
consists in marking the cells with all the markers present in the
study except the one of interest (Figure 6).
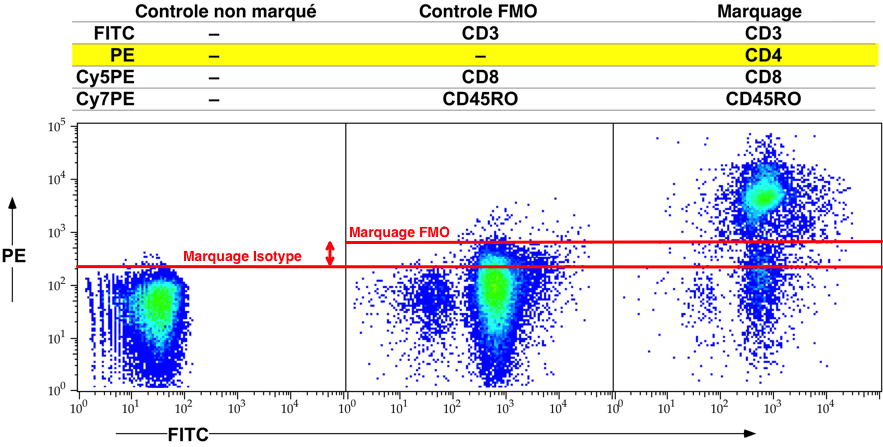 Figure
6 : Positivity threshold positioning, FMO method
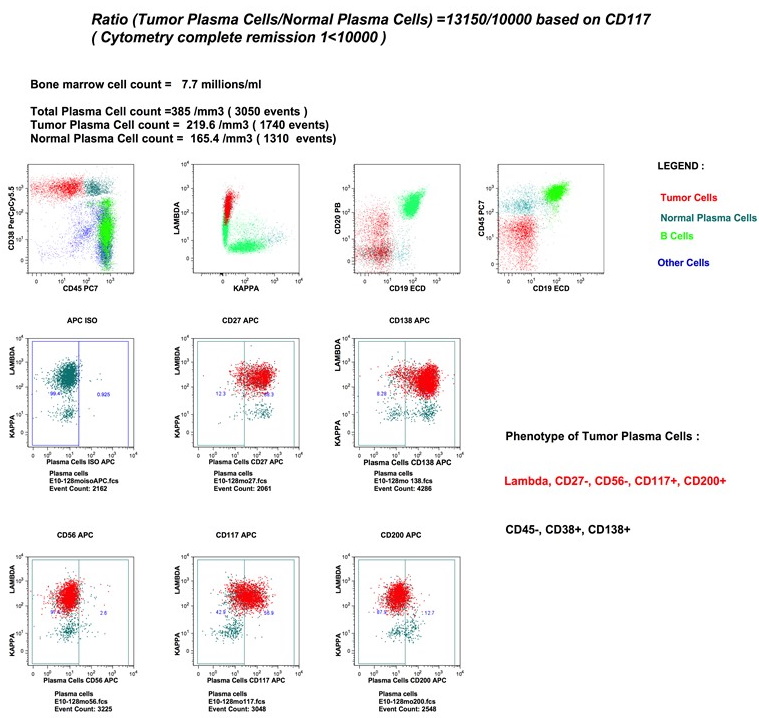
Once all the controls and
adjustments have been made, the immunofluorescence analyses can
be carried out, such as the search for tumor cells in the marrow
of patients with Multiple Myeloma (Figure 7)
Figure 7 : Multi-labeling
for tumor cell tracking in the marrow of multiple myeloma
patients
